Using the Cimar local viewer
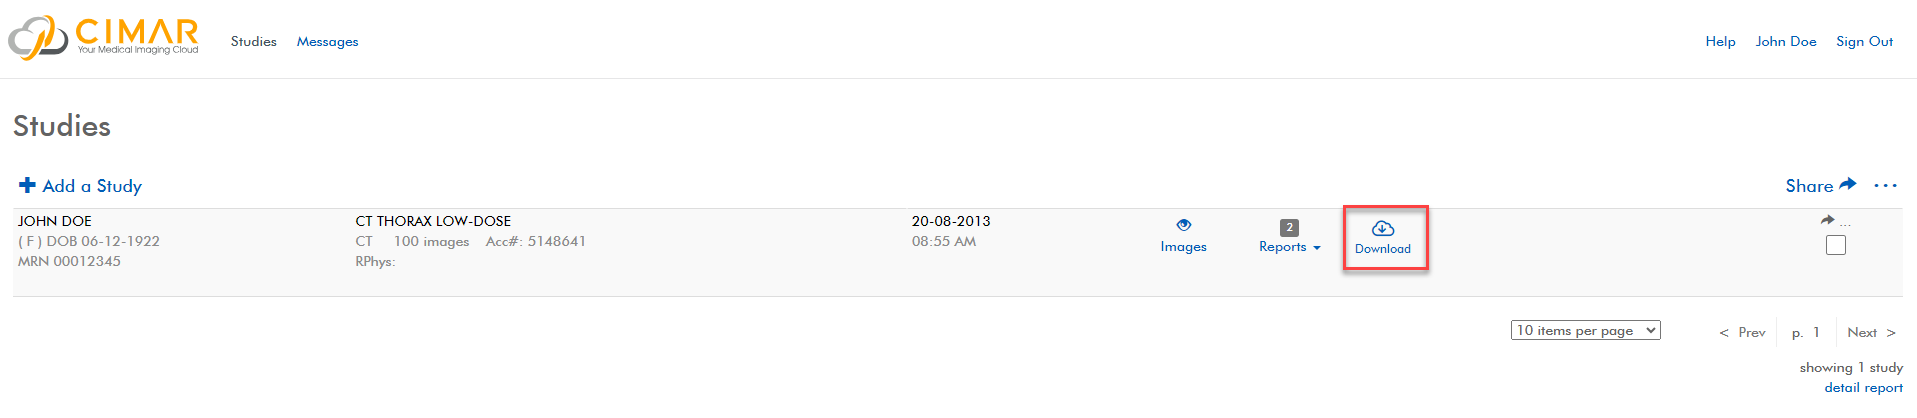
When downloading your study we will often provide you with the local viewer to view your downloaded images with. Sometimes however we will give you the choice on downloading the viewer or not, the option highlighted below will download your study along with the viewer wrapped in one. It's important to note that the platform will pre-determine your operating system and provide the necessary download.
Once you have downloaded the study you can open the ProViewer to begin viewing your images.
Ensure that the downloaded files have been extracted to a folder

This will open the downloaded images into the viewer application.
If using a Mac, a new browser with the local viewer link already in the search path will open, you can then drag your folder into the ProViewer to begin viewing your imaging. It will look like this:

From here you can return to your recently downloaded study and drag the entire folder into this window. That will load the study for you.
If you have multiple studies then you can use the same viewer to view them. To do this: clear the previous study by refreshing the page /clicking close -> Drag and drop the next study into the viewer.
From here the viewer is the same as it is on the platform, except there is a more limited set of tools available. The available tools are:

These allow you to from left to right:
- Show the different series available in the study on the left of the screen
- Select the view layout -> This allows you to view multiple series on your screen at once in a format of your choosing.
- Scroll through the images
- Zoom in
- Move the image around.
- Rotate the image
- Change the contrast and exposure of the imaging.
- Change the colour palette of the imaging.
- Default
- Invert
- Hot Iron
- Hot Blue
- Fire
All of the above can be reset by right clicking and choosing Reset display to reset.
- Measure your imaging in CM's by drawing a line over the area you want measured.
- Measure an angle. To do this select three points to 'draw' your angle.
- Draw a rectangle onto your imaging, this can be used to mark/point something out. Once draw it will tell you the area in CM squared.
- Write text onto your imaging.
All of the above can be reset by right clicking and choosing Delete Annotations
- Maximum intensity projection (MIP): A simple three-dimensional visualization tool that can be used to display computed tomographic angiography data sets
- Multiplanar reformation or reconstruction (MPR): the process of converting data from an imaging modality acquired in a certain plane, usually axial, into another plane.
- Volume: This stacks a series of two dimensional imaging allowing for more accurate representation of three dimensional imaging. Once this has been selected you will have the option to make it more translucent. It will also select the rotation tool for you allowing you to rotate the newly shown 3D image.
All of the above can be removed by clicking the cog under the new set of images and clicking remove.